
XField™
For the calculation of the locations of 2nd or 3rd adjacent LPFM or FM translator interference contours and for calculating and determining the locations of FM IBOC host interference when separate antennas are used.
2nd and 3rd adjacent interference calculations
 The XField 2.0 software package can be used when applying to the FCC for LPFM or FM translator stations that are 2nd or 3rd adjacent to full service stations or protected translator stations. The new software program is very useful to LPFM stations under new relaxed FCC rules allowing 2nd adjacent spacing of LPFM stations. The FCC requires a second or third adjacent translator or a 2nd adjacent LPFM station to have a signal strength of no more than 40 dB above the signal strength of the affected full-service station. The problem for the engineer is that it is a time consuming and laborious effort to calculate the interfering field strength of a translator, particularly one with a directional pattern, at all points where the U to D ratio could be above the required maximum of 40 dB. In order to properly consider the U to D ratio at all pertinent points, a translator or LPFM station’s antenna vertical elevation field must be considered. In many cases, where the proposed translator may have a rather low antenna, without consideration of the vertical elevation field at a given angle from the antenna, depending on the distance between the stations, it is very possible to exceed the 40 dB U to D ratio and for the applicant receive a dismissal from the Commission.
To consider the vertical elevation field of a given antenna, the engineer must calculate the location of the interfering signal contour of the translator or LPFM station’s antenna along various azimuths, distances and heights above ground from the translator antenna where buildings or major roads are located. The XField software solves this problem by employing the station’s vertical elevation field and azimuth pattern to produce a graph or table of the points and their heights above ground along various radials from the antenna where the signal level exceeds the 40 db ratio. A translator station can be brought into compliance by either reducing its ERP, using a directional antenna, using an antenna with more bays (keeping the higher signal strength away from the immediate tower location) or increasing the translator’s antenna height. The LPFM station can use an antenna that has a reduced downward radiation pattern if necessary. The XField graph below shows the distance and height above ground of the interfering contour of a translator station at an azimuth of 210 degrees true north in the presence of a full service station. The vertical scale is a measure of the interfering contour’s distance above ground, in meters, while the horizontal scale is a measure of the actual distance from the translator’s antenna in meters. In this case, if there were a 56 meter tall building at 285 meters from the translator’s antenna, the FCC would likely reject the application because it causes prohibited interference.
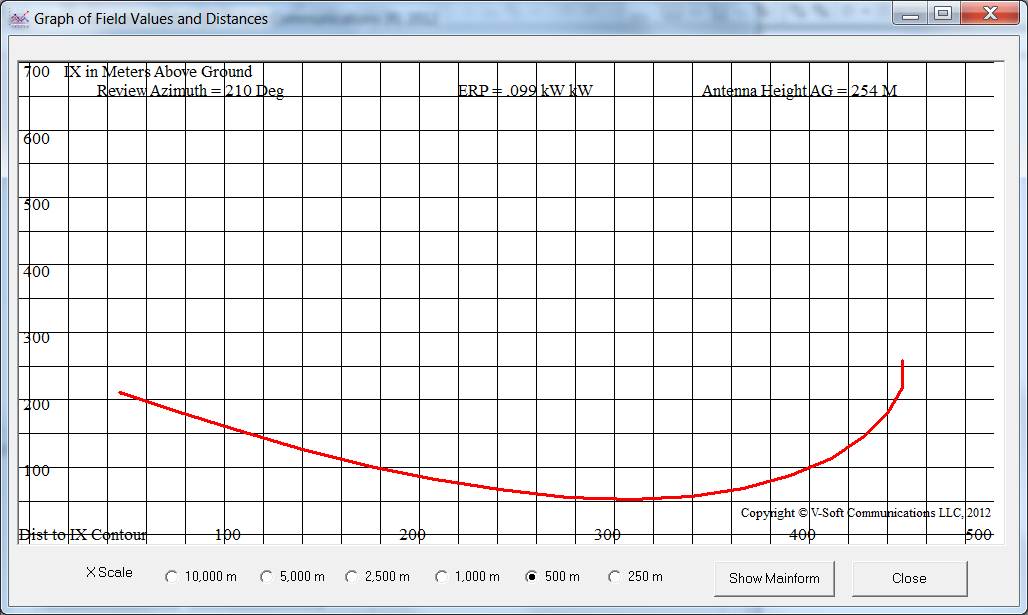
For illustration, the program’s main interface is shown at the top of this page. Station data can be drawn from the included FCC FM and TV database. Once a study is performed, all parameters can be saved as a work file and reloaded at a future date. The table used to generate this graph and to submit to the FCC is shown below. This table and its format resulted from extensive conversation with the FCC regarding the presentation they wanted to see for the table..
To produce a table, click the “Show Table” button. This button will produce a Section 74.1204(d) showing by, writing it to the Window’s Notepad. The study below was performed with a “Review Azimuth” of 210 degrees. The first column is the depression angle from the antenna at five degree increments. The second is the relative vertical elevation field at the depression angle. The third column is the translator station’s ERP. The fourth column is the distance to the interference contour along the depression angle. In this case, the interference contour is 103.677 dBu which is obtained by calculating the protected station’s signal contour at the translator’s transmission site and then adding 40 dB, since you are protecting a station which is 2nd or 3rd adjacent to the translator’s channel. The fourth column is the horizontal distance to the interference contour from translator site along the ground and the fifth column is the distance above ground where the interference contour exists. All distances are in meters. Clearly, if there is a building tall enough to enter above ground area of the interference contour, the interference will be prohibited. The engineer must then either use an antenna with a relative field that puts a smaller power at the depression angle, use a directional antenna to reduce power toward the point, or raise the antenna on the tower.
 XField comes with numerous vertical elevation field graph files for single to multiple bayed antennas in full-wave and half-wave configuration. The screen below shows a ten-bay vertical field pattern for the SHPX10.VEP. All clients signed up for the V-Soft technical support program can download numerous Scala and Kathrein directional antenna azimuth and vertical elevation patterns in the V-Soft format.
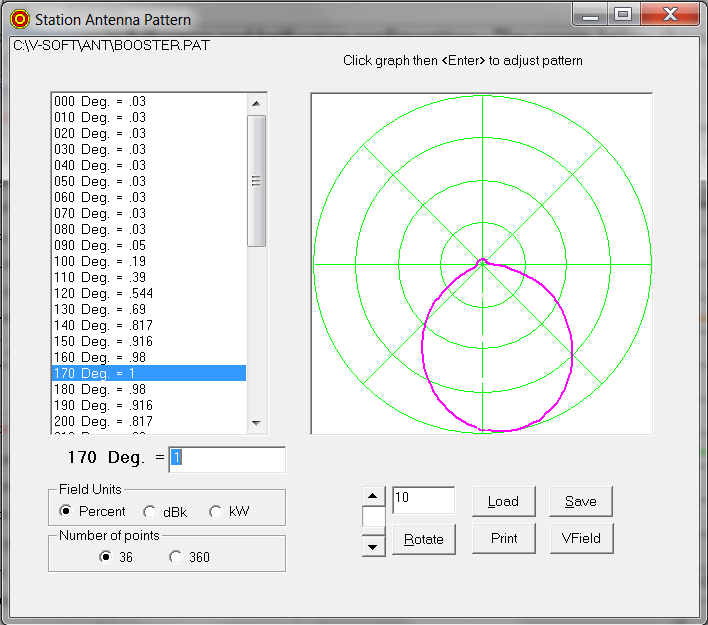
 Azimuth patterns can also be loaded and considered in the calculations. The screen below shows an azimuth pattern that can be used with the program. The pattern can be edited in effective field, dBk or kW and it can be rotated (edited if desired) and then saved. The user can work with 36 points or 360 pattern points.
 IBOC Host interference Calculations:
 The screen portion above shows an example of a 100 kW station and a 1 kW IBOC station located on the same tower structure. Using the “Browse” button, the Test Reference Station can be drawn from the provided FM and TV databases.
The graphic above is a portion of the Main screen. The IBOC study assumes that you will be operating with a separate IBOC antenna on the same tower. You can select the vertical elevation field graphs of the host station and that of the proposed IBOC station antenna. Click the “Antenna #2, V-Field” button to select the IBOC antenna’s vertical elevation field pattern. Enter the ERP you propose for the IBOC antenna. Then, enter the height above ground of the antenna. Note that the 70% button, puts the IBOC antenna at the maximum vertical distance allowed from the host antenna. In the study shown below, the user has selected a ten-bay half-wave antenna for the host station and a 2-bay full-wave antenna for the IBOC antenna.
The IBOC graph below shows the signal values of the host station and that of the IBOC station. Since IBOC operates using about 1/2 of the first adjacent channel, the graph uses the FCC’s first adjacent D/U of -6 dB. When the IBOC signal rises within the host station’s signal by -6 dB or more one can expect receiver interference to the host station’s analog broadcasts. We have authored a paper which was published in RW’s Engineering Extra showing that the locations of the interference predicted on the graph are highly associated with the locations from listeners who call the station to complain about interference.
https://www.radioworld.com/tech-and-gear/the-looming-danger-of-digital-host-interference
 The portion of the graph that turns red shows that the points where the predicted signal strength of the IBOC station is less than 6 dB below the signal of the host station. In this case, assuming a non-directional host antenna, there will be a ring of interference around the antenna between 0 and ~260 meters from the tower. Additional rings will be found at ~400 meters, ~600 meters to 830 meters and at ~1200 to 1770 meters. This study is for a -20 dBc IBOC power. Imagine the host interference for this setup using -10 dBc. Directional azimuth patterns can be loaded for both the host and the IBOC antennas.
Complete XField’s studies can be saved to disk and opened for future use when desired. XField can be used with any of the V-Soft terrain elevation databases, (provided as an option.)